- Attenborough.film
- Compare
- PT1 vs HU715Q
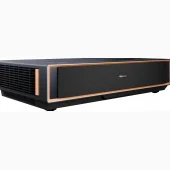
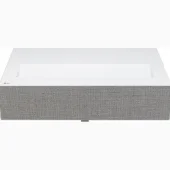
Hisense PT1 vs LG HU715Q
What PT1 does better (3) and where HU715Q wins (1) — every spec side by side.
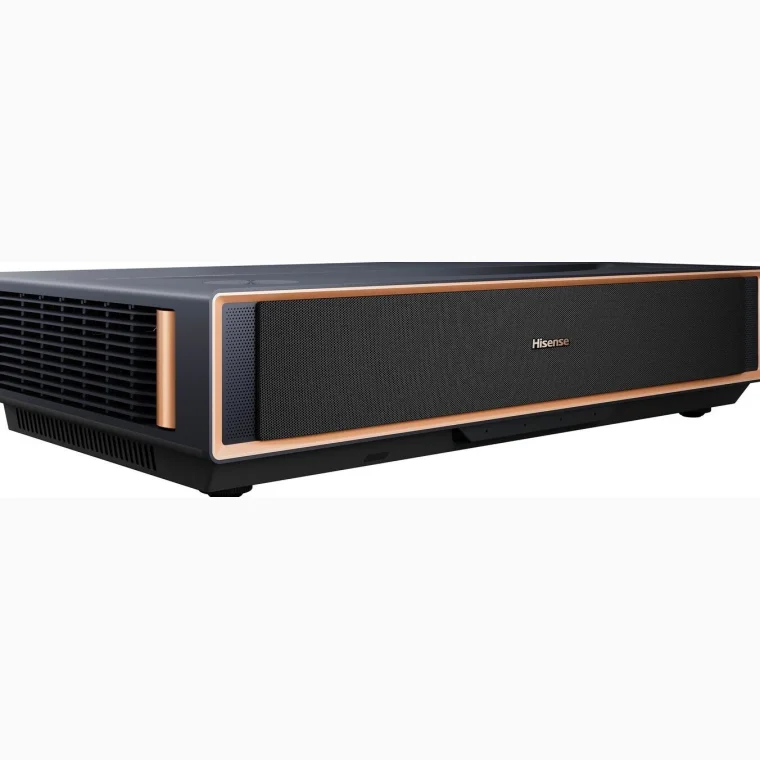
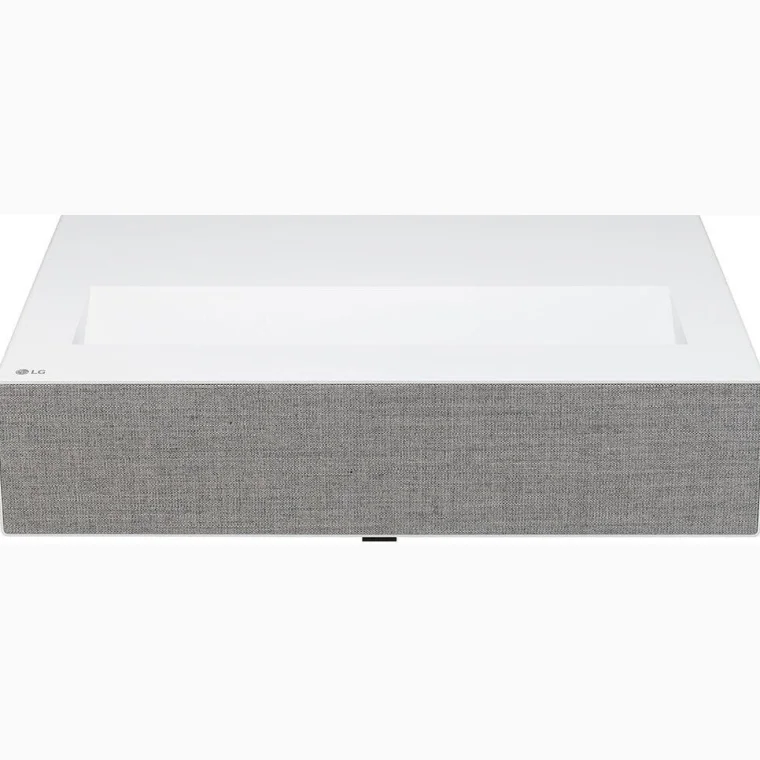
Why is PT1 better than HU715Q?
- HDMI inputs3 vs 13×
- Audio outputYes · HU715Q: No
- Largest image size150″ vs 120″+25%
Why is HU715Q better than PT1?
- Contrast ratio (dynamic / claimed)3,000:1 vs 2,000,000:1666.7×
Specifications
Side by side
| Picture | ||
| Resolution (on screen) | 3840 × 2160 (4K UHD) | 3840 × 2160 (4K UHD) |
| Native panel resolution | 1920 × 1080 (Full HD) | 1920 × 1080 (Full HD) |
| 4K method | 4K by pixel shifting | 4K by pixel shifting |
| Display technology | DLP | DLP |
| Light source | Laser | Laser |
| Brightness (ANSI / ISO lumens) | 2,500 lm | 2,500 lm |
| Contrast ratio (dynamic / claimed) | 3,000:1 | 2,000,000:1 |
| HDR support | Yes | — |
| HDR formats | HDR10+, HDR10, Dolby Vision | — |
| Dolby Vision | Yes | — |
| Gaming | ||
| Game / low-latency mode | Yes | — |
| Lens & placement | ||
| Throw ratio | — | 0.22:1 |
| Throw type | — | Ultra short throw (under 0.4:1) |
| Distance for a 100″ 16:9 image | — | 0.49 m |
| Smallest image size | 80″ | 80″ |
| Largest image size | 150″ | 120″ |
| Optical zoom | — | 1.6× |
| Lens shift | None | — |
| Autofocus | — | No |
| Sound | ||
| Built-in speakers (total output) | 30 W | — |
| Smart & streaming | ||
| Smart platform | VIDAA | — |
| Built-in smart platform | Yes | — |
| Netflix (officially licensed) | Yes | — |
| Wi-Fi | Yes | — |
| Bluetooth | Yes | — |
| AirPlay | Yes | Yes |
| Connectivity | ||
| HDMI inputs | 3 | 1 |
| HDMI version | 2.1 | 2.1 |
| USB port | Yes | Yes |
| Ethernet (LAN) | Yes | Yes |
| VGA input | No | No |
| Audio output | Yes | No |
| Battery, power & lifetime | ||
| Power consumption | 200 W | — |
| Light source life | 25,000 h | — |
| Design & noise | ||
| Fan noise | 32 dB | — |
| Weight | 7.2 kg | — |
| Width | 521 mm | — |
| Height | 119 mm | — |
| Depth | 282 mm | — |
| Colours | Black | White |