How we score Blog Advertise
  1. Attenborough.film
  2. Spec guide
  3. Throw ratio
Lens & placement

Throw ratio: typical values for projectors

Half of projectors in the catalog have throw ratio below 1.2:1, and 80% fall between 0.3:1 and 1.5:1 (495 models with data).

Median1.2:1
Median 20261.2:1
Typical range0.3:1 – 1.5:1
Models495
Distribution

How throw ratio is distributed

0459113618100.40.81.21.60–0.2: 170.2–0.4: 340.4–0.6: 160.6–0.8: 100.8–1: 191–1.2: 1811.2–1.4: 1221.4–1.6: 821.6–1.8: 14Median 1.2:1
Percentile10 %25 %50 %75 %90 %
Throw ratio0.3:11.1:11.2:11.4:11.5:1

A model at the 75th percentile beats three quarters of the catalog on this spec.

Trends

Median throw ratio by year

0:10.4:10.8:11.1:11.5:1201820192020202120222023202420252026
Recent leaders

Highest throw ratio

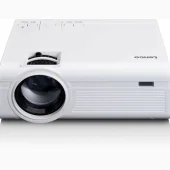
1 Lenco LPJ-280WH
Lenco · 2025
LPJ-280WH
1920 × 1080 (Full HD)LED
2:1
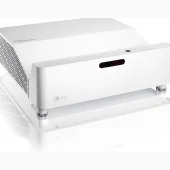
2 Optoma GT3500HDR
Optoma · 2024
GT3500HDR
1920 × 1080 (Full HD)3,800 lmLaser
2:1
3.7
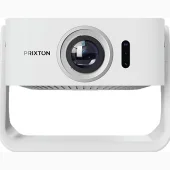
3 Prixton Renoir
Prixton · 2026
Renoir
1920 × 1080 (Full HD)280 lmLED
2:1
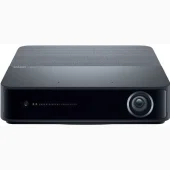
4 Loewe We. Beam
Loewe · 2024
We. Beam
1920 × 1080 (Full HD)500 lmLaser0.83 kg
2:1
8.4
5 Strong Estelle One 4G
Strong · 2026
Estelle One 4G
1920 × 1080 (Full HD)200 lmLED
2:1
3.6
6 Acer SL2820n Vero
Acer · 2026
SL2820n Vero
3840 × 2160 (4K UHD)4,000 lm
2:1
7 Optoma HZ147X
Optoma · 2026
HZ147X
1920 × 1080 (Full HD)4,000 lmLaser
2:1
4.7
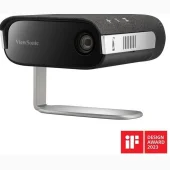
8 ViewSonic M1XG
ViewSonic · 2026
M1XG
1920 × 1080 (Full HD)360 lmLED
2:1
6.0
9 Optoma GT2200HDR
Optoma · 2026
GT2200HDR
1920 × 1080 (Full HD)3,300 lmLED
2:1
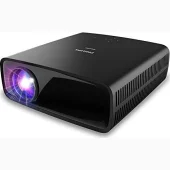
10 Philips NeoPix 730
Philips · 2023
NeoPix 730
1920 × 1080 (Full HD)LED2.7 kg
1.7:1
8.9
To compare: 0up to 4 models
Compare