- Attenborough.film
- Compare
- Apollo vs M1
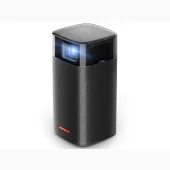
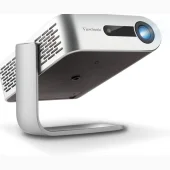
Nebula Apollo vs ViewSonic M1
What Apollo does better (2) and where M1 wins (1) — every spec side by side.
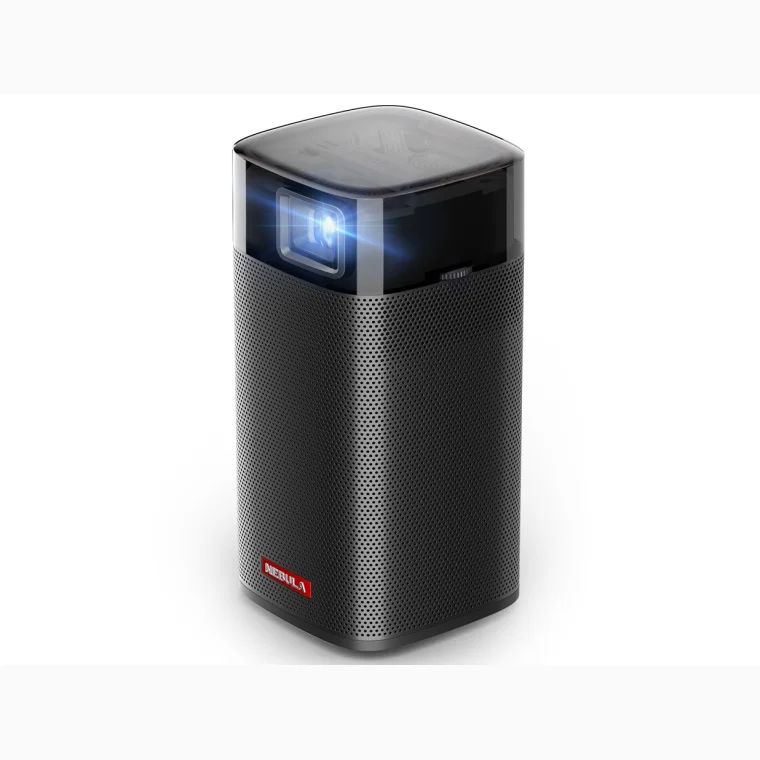
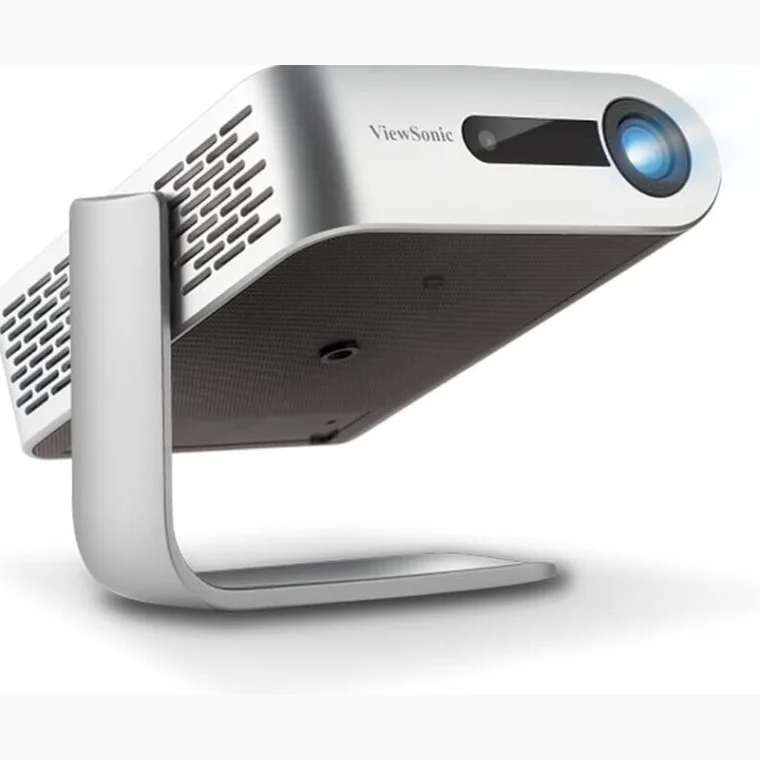
Dimensions
Size comparison
ApolloM1
| Apollo | M1 | Difference | |
|---|---|---|---|
| Height | 131 mm | 41 mm | +90 mm |
| Width | 65 mm | 148 mm | −83 mm |
| Depth | 65 mm | 126 mm | −61 mm |
| Weight | 0.6 kg | 0.8 kg | −0.2 kg |
Drawn to the same scale from the official dimensions (front and side).
Why is Apollo better than M1?
- Automatic keystone correctionYes · M1: No
- Weight0.58 kg vs 0.8 kg+38%
Why is M1 better than Apollo?
- Brightness (ANSI / ISO lumens)200 lm vs 250 lm+25%
Specifications
Side by side
| Picture | ||
| Resolution (on screen) | — | 854 × 480 (480p) |
| Native panel resolution | — | 854 × 480 (480p) |
| Display technology | DLP | DLP |
| Light source | LED | LED |
| Brightness (ANSI / ISO lumens) | 200 lm | 250 lm |
| Contrast ratio (dynamic / claimed) | — | 120,000:1 |
| HDR support | — | No |
| Gaming | ||
| Maximum refresh rate | — | 120 Hz |
| Lens & placement | ||
| Throw ratio | 1.39:1 | 1.2:1 |
| Throw type | Standard throw (1.0:1 and longer) | Standard throw (1.0:1 and longer) |
| Distance for a 100″ 16:9 image | 3.08 m | 2.66 m |
| Smallest image size | — | 24″ |
| Largest image size | — | 100″ |
| Lens shift | — | None |
| Keystone correction | Yes | Yes |
| Automatic keystone correction | Yes | No |
| Sound | ||
| Built-in speakers (total output) | — | 6 W |
| Smart & streaming | ||
| Wi-Fi | Yes | Yes |
| Bluetooth | Yes | — |
| Connectivity | ||
| HDMI inputs | 1 | 1 |
| USB port | Yes | Yes |
| Ethernet (LAN) | — | No |
| VGA input | — | No |
| Audio output | — | Yes |
| Battery, power & lifetime | ||
| Built-in battery | Yes | Yes |
| Power consumption | — | 55 W |
| Light source life | — | 30,000 h |
| Design & noise | ||
| Fan noise | 30 dB | — |
| Weight | 0.58 kg | 0.8 kg |
| Width | 65 mm | 148 mm |
| Height | 131 mm | 41 mm |
| Depth | 65 mm | 126 mm |